Google DeepMind releases ForTy 2020, a 10-meter global forest-type map
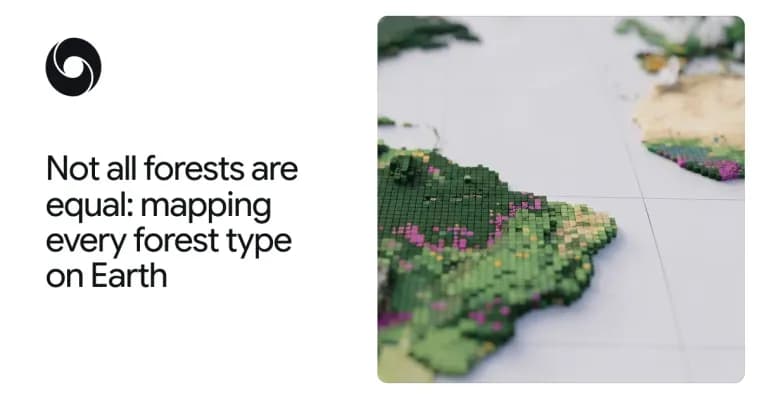
Google DeepMind and Google Research, together with the World Resources Institute (WRI) and the International Institute for Applied Systems Analysis (IIASA), have released Forest Typology (ForTy) 2020. It is a global map that classifies every 10-by-10-meter patch of land on Earth into one of six forest and land-use types. The authors describe it as a key baseline for the EU's deforestation regulation. Alongside it comes an early-release time series that tracks how these forests changed each year from 2017 to 2025, including where natural forests were replaced by plantations or farms. The authors say that for the first time users can see, at 10-meter detail worldwide and year by year, not just where forest was lost but what replaced it: a timber plantation, a tree-crop farm or other land.
The problem the team starts from is that most global maps only show whether trees are present. An old-growth rainforest, a eucalyptus plantation and an oil palm estate can look like the same green patch from space, yet they hold very different amounts of carbon and biodiversity. The EU regulation on deforestation-free products (EUDR) requires that products such as coffee, cocoa or palm oil do not come from land that was forest in 2020 and has since been converted to agriculture. Wood products such as furniture must also be free of forest degradation: they cannot come from primary forests later converted into plantation or planted forests, or from naturally regenerating forests later converted into plantation forests. So companies and regulators need to know what kind of forest they are looking at, not just where trees stand.
The same partners released Natural Forests of the World 2020 last year, a 10-meter map that separated natural forests from all other tree cover and answered one question per patch: was it natural forest in 2020 or not? ForTy goes further by showing the kind of forest, and the new time series shows how it changes each year.
ForTy sorts land into six categories based on definitions from the UN Food and Agriculture Organization (FAO). Primary forest is native forest with no visible signs of human disturbance. Naturally regenerating forest grew back on its own, for example after logging or fire. Planted forest was planted or seeded by people and managed over long cycles. Plantation forest means fast-growing, intensively managed tree farms, often of one species. Tree crops and agroforestry covers farms growing things other than wood, such as oil palm, rubber, cocoa or fruit. Other land is everything else, from grassland and cropland to cities and water.
Training was hard because these categories depend partly on how land is used, not just how it looks. The team built a collection of forest-type examples with about 1.7 million labeled locations, drawn from expert surveys, national and regional datasets, and targeted reviews of places where the model struggled. The model uses a custom architecture designed for remote sensing data. A key input is AlphaEarth Foundations embeddings, data-compact summaries of years of satellite observations for each 10-meter pixel, which let it pick up subtle clues such as planting patterns, growth cycles and harvest rhythms.
For validation, the team worked with IIASA and WRI to check ForTy against more than 9,000 randomly chosen sites around the world. At each site, two trained experts studied high-resolution imagery and years of satellite records to decide which type of land was really there. ForTy picked the right forest type 90% of the time and told forest apart from non-forest land 95% of the time, which the authors say outperforms other global forest maps.
ForTy does not hand out a yes-or-no label per patch. It gives a probability score for each class, so users can adapt the classification to regional context and to how much precision they need. The authors' example: a company assessing deforestation risk under EUDR might accept only pixels the model is highly certain about, to avoid regulatory risk, while a researcher estimating total forest extent might use the full range of probabilities.
The time series applies a similar approach to every year from 2017 to 2025. It shows where forests disappear and where they grow back, and what kind of change happened, such as a natural forest turning into a timber plantation or abandoned land slowly regenerating into forest. The authors argue this matters because some of the most important changes are hard to see from space. When a natural forest is logged and replanted as a plantation, the land soon looks green again, so standard tree-cover maps might not pick up the change. The time series is meant to make these hidden losses and gains visible.
The 2020 map, described in Scientific Data, and the time series are freely available on Google Earth Engine under an open license. The authors hope governments, companies, conservation groups and scientists will use them to build deforestation-free supply chains, direct forest finance where it is needed, and protect the natural forests that matter most. The time series is an early release, and the team says it will keep improving it over the coming months with partners and users. ForTy is part of the team's AI for Nature research, which also covers mapping the drivers of forest loss, forecasting deforestation risk, modelling global species distributions and monitoring biodiversity in the field, and is the latest addition to Google Earth AI.
Key facts
- ForTy 2020 classifies every 10-by-10-meter patch of land worldwide into six types: primary forest, naturally regenerating forest, planted forest, plantation forest, tree crops and agroforestry, and other land.
- An early-release annual time series covers 2017 to 2025 and shows what replaced lost natural forest, such as a timber plantation or tree-crop farm.
- On more than 9,000 randomly chosen validation sites, each reviewed by two trained experts, ForTy picked the right forest type 90% of the time and separated forest from non-forest 95% of the time.
- The model was trained on about 1.7 million labeled locations and uses AlphaEarth Foundations embeddings as a key input.
- Both the map and the time series are free on Google Earth Engine under an open license; ForTy outputs a probability per class so users can set their own thresholds.
Why it matters
Most global maps only say whether trees are present, and that is not enough for rules like the EU deforestation regulation, which treats primary forest converted to plantation differently from a healthy forest. ForTy adds the forest type, and the time series adds what replaced lost forest, year by year at 10-meter detail. The authors call this a first. It follows last year's Natural Forests of the World 2020, which only said whether a patch was natural forest in 2020 or not. The authors call ForTy 2020 a key baseline for the EUDR.
Who it affects
The authors name governments, companies, conservation groups and scientists. Companies and regulators checking EUDR compliance for goods such as coffee, cocoa, palm oil and wood products are the clearest case, since those rules turn on what kind of land a product came from. Researchers estimating forest extent and groups directing forest finance are also named as intended users.
How to use it
The 2020 map and the early time series are available on Google Earth Engine under an open license. Each pixel carries a probability score per class instead of a hard label. A company assessing EUDR risk might keep only pixels the model is highly certain about, while a researcher estimating total forest extent might use the full spectrum of probabilities. The authors invite users to report how they use the data.
How solid is it
The map was checked against more than 9,000 randomly chosen sites worldwide. At each, two trained experts reviewed high-resolution imagery and years of satellite records. ForTy picked the right forest type 90% of the time and separated forest from non-forest 95% of the time. The authors say this outperforms other global forest maps, but the post does not name those maps. The validation was run with IIASA and WRI, which are also co-developers. The 2020 map is described in Scientific Data. The 90% and 95% figures refer to the 2020 map; the time series's accuracy is not reported.
Risks and caveats
The time series is an early release, and the authors say they will keep improving it over the coming months. The headline accuracy figures are overall numbers; no per-class or per-region breakdown is given. The post also gives no area or percentage figures for how much forest was converted to plantations or farms. The categories depend partly on land use, not just appearance, which the authors say made training hard. Because ForTy gives probabilities, results depend on the threshold each user picks.