Google Earth AI's PDFM location embeddings tested on five public health tasks
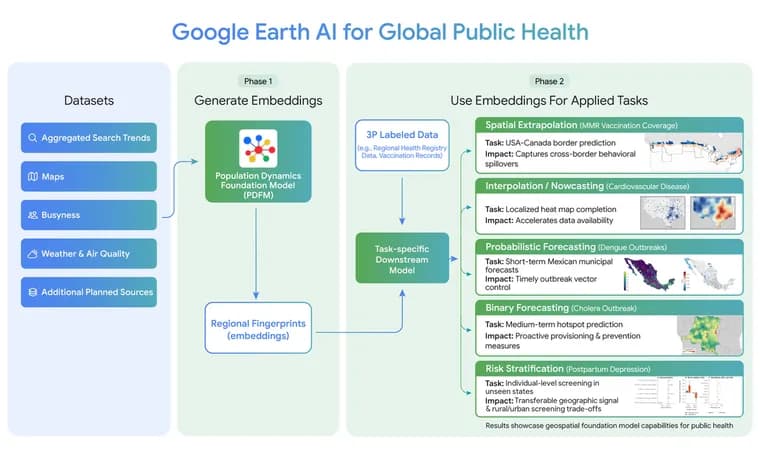
On October 6, 2026, Google Research software engineers Arbaaz Muslim and Gautam Prasad published a post on Google Earth AI's Population Dynamics Foundation Model (PDFM). It presents five partner-driven case studies meant to show how a planetary geospatial foundation model can fill the data gaps and reporting lags of epidemiological workflows. The authors say conventional surveillance is hampered by multi-year reporting lags, data siloed by geopolitical borders and sparse data, and that traditional modeling needs task-specific data collection and custom pipelines that are hard to deploy during fast outbreaks or in low-resource settings.
PDFM compresses privacy-preserving search trends, human mobility, built-environment density and environmental determinants into compact location embeddings, described as "fingerprints" for places and refreshed monthly. The idea is that epidemiologists can plug them into the statistical and machine learning models they already use instead of building new pipelines. According to the post, without task-specific fine-tuning these off-the-shelf embeddings matched or improved on conventional inputs across many disease domains, geographic settings and epidemiological tasks. Global health research partners ran independent evaluations on five challenges.
Measles and vaccination: in the 146 US counties within 150 km of the Canadian border, domestic-only models often struggle to predict vaccine uptake. Researchers at the Mount Sinai Health System and Boston Children's Hospital added embeddings for Canadian Forward Sortation Areas to US county embeddings. The share of variation in MMR vaccination coverage explained by the models rose from 16% to 22% (a 36% relative increase), and coverage estimates were refined by at least 3 percentage points for 4.7 million border residents.
Cardiovascular disease: CVD claims over 916,000 lives a year in the US, but unsuppressed county-level NVSS mortality data typically lags by 1 to 2 years and American Community Survey covariates reflect conditions up to 2 to 3 years back. Partners at NYU Grossman School of Medicine tested whether PDFM could replace these census-based inputs when estimating current-year CVD deaths across roughly 3,100 US counties. They found no statistically significant differences between PDFM and traditional census data, with PDFM much fresher and available in far more places.
Dengue: with public health researchers at the University of Oxford and Tecnologico de Monterrey, Google coupled PDFM with TimesFM 2.0, its open time-series foundation model, to forecast dengue cases across about 2,450 Mexican municipalities from 2020 to 2025. The biggest gains came one month ahead, where forecast accuracy improved in up to 72% of municipalities with active transmission, and total error reductions were 3.4 times larger than degradations.
Postpartum depression: University of Washington researchers evaluated PDFM embeddings across 332,970 participants in the CDC PRAMS national survey. The embeddings captured community-level socioeconomic conditions (R2=0.45) and gave a consistent, statistically significant boost in predicting which mothers were at risk (AUC +0.0020 in states seen in training, +0.0038 in unseen states). In unseen states the signal recovered about 15% of the predictive signal of a mother's own income and insurance records when those are unavailable. In simulations where a health system follows up with the 20% highest-risk mothers, adding PDFM reached 5,640 more rural mothers with postpartum depression each year. For systems aiming to catch 80% of all cases, it cut 17,723 false alarms annually.
Cholera: using a use case defined by the WHO Regional Office for Africa and national surveillance data from the Democratic Republic of the Congo, the team tested a lightweight, low-resource PDFM version adapted for regions with sparse internet connectivity. Outbreaks are rare: in any given week fewer than 1 in 100 of the country's 403 health zones sees one begin. One or two weeks ahead, recent case counts told most of the story and PDFM did not significantly improve accuracy. Four to eight weeks ahead, when there is still time to move supplies, it helped. The authors conclude that the embeddings capture environmental, connectivity and population determinants that supplement historical data, allowing proactive planning one to two months in advance.
The authors note that current limitations, such as static snapshots, are driving research into temporally dynamic embeddings and geographic transfer learning for under-connected regions. PDFM embeddings are commercially available in Preview as Population Dynamics Insights, a geospatial embeddings dataset from Google Maps Platform. Academics and public health researchers can request no-cost access for select, non-operational research use cases.
Key facts
- Google Research presents five partner-run case studies of PDFM in public health: measles vaccination near the US-Canada border, US cardiovascular deaths, dengue in Mexico, postpartum depression in the US and cholera in the DRC.
- Adding Canadian cross-border embeddings raised the share of MMR coverage variation explained from 16% to 22% in 146 US border counties, and refined estimates by at least 3 percentage points for 4.7 million residents.
- For dengue in about 2,450 Mexican municipalities, one-month-ahead forecasts improved in up to 72% of actively transmitting municipalities, with error reductions 3.4 times larger than degradations.
- For cholera in the DRC, PDFM did not significantly improve forecasts one or two weeks ahead but helped at four to eight weeks.
- PDFM embeddings are in Preview as Population Dynamics Insights from Google Maps Platform; academics and public health researchers can request no-cost access for select, non-operational research use.
Why it matters
Public health decisions depend on timely, granular data, and the post argues that multi-year reporting lags, borders and data sparsity get in the way. The authors present PDFM as a proof of concept for a new paradigm: pre-trained representations of places that drop into existing epidemiological models as plug-and-play inputs rather than requiring new pipelines. The CVD case shows the freshness argument most plainly, since official county mortality data lags by 1 to 2 years while PDFM embeddings refresh monthly. The cholera case shows where the approach adds little: short horizons, where recent case counts already carry most of the signal.
Who it affects
Epidemiologists and health departments working with surveillance data are the main audience. The case studies involve researchers at Mount Sinai and Boston Children's Hospital, NYU Grossman School of Medicine, the University of Oxford and Tecnologico de Monterrey, and the University of Washington, plus a WHO Regional Office for Africa use case in the DRC. The populations touched include 4.7 million US-Canada border residents, roughly 3,100 US counties, about 2,450 Mexican municipalities, 332,970 PRAMS survey participants and 403 Congolese health zones. Groups in low-connectivity regions are addressed by the lightweight version used for cholera.
How to use it
PDFM embeddings are commercially available in Preview as Population Dynamics Insights, a geospatial embeddings dataset from Google Maps Platform. Academics and public health researchers can request no-cost access, limited to select, non-operational research use cases. The post describes feeding the embeddings into existing statistical and ML models as extra inputs, as in the dengue study, where PDFM was paired with TimesFM 2.0. No pricing is given.
How solid is it
The post is written by two Google Research engineers about Google's own model, but it states that partner institutions facilitated independent evaluations. Several results carry hedges: the 72% dengue figure is a maximum at one month ahead, not an average, and the authors say the CVD results suggest, rather than prove, that PDFM can help health departments act on current conditions. The CVD finding is parity with census data (no statistically significant differences), not an improvement. The postpartum depression AUC gains are +0.0020 in seen states and +0.0038 in unseen states, though described as statistically significant. The post points readers to a paper for details.
Risks and caveats
The authors name current limitations such as static snapshots and say research into temporally dynamic embeddings and geographic transfer learning for under-connected regions is under way. PDFM did not significantly help cholera forecasts one or two weeks out. The 'matched or improved' claim is the authors' summary across five studies, and the cross-border finding is hedged: such context may reveal patterns that domestic-only models miss. Research access is limited to non-operational uses, and the embeddings draw on search trends and mobility data, which the post describes as privacy-preserving.
“Geospatial foundation models enable moving from reactive, localized modeling to proactive and time-sensitive health intelligence at planetary scale.”
— Arbaaz Muslim and Gautam Prasad, Google Research