E2A-Bench finds financial fine-tuning skews VLMs' BUY:SELL ratio by 4x+
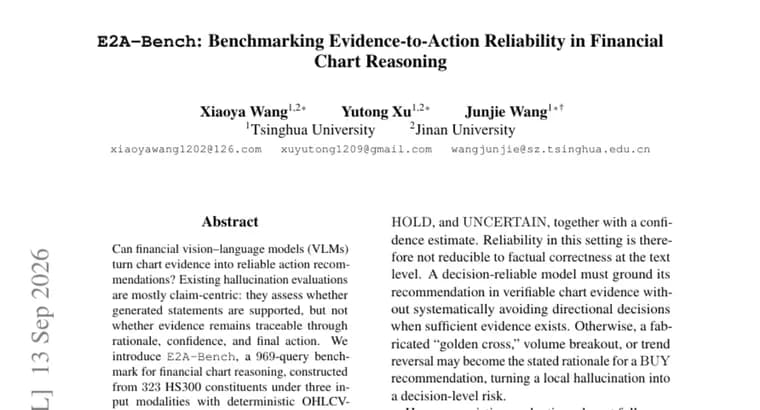
Most hallucination evaluations for financial vision-language models are claim-centric: they check whether a model's individual statements are backed by the evidence, but not whether that evidence stays connected through the model's rationale, its stated confidence, and the BUY or SELL action it ultimately recommends. E2A-Bench, from Xiaoya Wang and co-authors, is built to test that fuller chain instead of a single hallucination score.
The benchmark is a 969-query set for financial chart reasoning, assembled from 323 constituents of the HS300 index under three input modalities. Each query is anchored to deterministic evidence derived from OHLCV chart data (open, high, low, close, and volume), so the evidence a model is judged against is fixed rather than assigned by a human rater.
E2A-Bench scores four things through four matching metrics: grounding through UCR, reasoning-action consistency through RCI, evidence-confidence calibration through ECI, and directional coverage through NDR. The paper is explicit that NDR, the coverage metric, measures coverage-aware evidence-to-action reliability, not realized trading performance: a high NDR score says the chain from evidence to action holds together and covers enough queries, not that the resulting BUY or SELL calls would have made money.
Running 20 VLMs through the benchmark turned up three failures a single hallucination score would not catch. The model with the lowest UCR score, the kind of result a narrow hallucination check would treat as strong, ranked near the bottom on NDR, because it produced an actual directional call for only 6.4% of queries. Oracle-aided verification reduced unsupported claims but could collapse that same coverage, so a model can be made to look less prone to hallucination simply by answering fewer queries with a real call. And when the authors strictly paired each base model with its financial fine-tuned version, fine-tuning amplified the BUY:SELL ratio by a factor of 4.21 to 4.68.
The authors conclude that evaluating financial VLMs should trace the full evidence-to-action chain rather than rely on a single hallucination score, since that scalar number can hide exactly the failures E2A-Bench is built to surface. Code and data for the benchmark are published on GitHub at wanng-ide/E2A-Bench.
Key facts
- E2A-Bench is a 969-query benchmark for financial chart reasoning, built from 323 constituents of the HS300 index under three input modalities, with evidence anchors derived deterministically from OHLCV chart data.
- It scores models on four axes via four metrics: grounding (UCR), reasoning-action consistency (RCI), evidence-confidence calibration (ECI), and directional coverage (NDR), with NDR measuring coverage-aware evidence-to-action reliability rather than realized trading performance.
- Across 20 evaluated VLMs, the model with the lowest UCR score ranked near the bottom on NDR because it issued an actual directional call for only 6.4% of queries.
- Oracle-aided verification cut unsupported claims but could collapse that same directional coverage.
- Financial fine-tuning amplified the BUY:SELL ratio by a factor of 4.21 to 4.68 across strict base-to-fine-tuned model pairs.
Why it matters
Existing hallucination checks for financial VLMs are claim-centric: they test whether a generated statement is backed by evidence, not whether that evidence stays connected through the model's rationale, its confidence, and the BUY or SELL call at the end. E2A-Bench is built to close that gap with four metrics, UCR for grounding, RCI for reasoning-action consistency, ECI for evidence-confidence calibration, and NDR for directional coverage, so a model's output can be checked end to end rather than one claim at a time. The paper's stated conclusion is that financial VLM evaluation should trace this full chain rather than lean on a single hallucination score, because that scalar number can hide exactly the failures the benchmark was built to surface.
Who it affects
The direct audience is teams that build or evaluate financial vision-language models, systems meant to read a chart and suggest a trade. The benchmark's central point, that a scalar hallucination score can hide real failures, also speaks to anyone designing evaluation metrics for AI systems more broadly. And the fine-tuning finding matters specifically to anyone fine-tuning a general VLM on financial data: the paper reports that doing so can shift a model's own BUY:SELL balance by a factor of 4.21 to 4.68, a bias the researchers flag as a hidden risk of that kind of fine-tuning.
How to use it
The benchmark's code and data are published on GitHub at wanng-ide/E2A-Bench. A team evaluating its own financial-chart VLM can run it against the 969 queries built from 323 HS300 constituents and come away with four separate scores, covering grounding, reasoning-action consistency, evidence-confidence calibration, and directional coverage, instead of one hallucination number. That is the practical shift the paper argues for: check the whole path from chart to call, not just whether individual statements hold up.
How solid is it
HuggingFace credits Xiaoya Wang as an author, alongside co-authors the text does not name, and gives no institution, venue, or publication date. The text also does not report the underlying UCR, RCI, or ECI scores, or the number of strict base-to-fine-tuned pairs behind the fine-tuning comparison, so the two headline figures, 6.4% directional coverage and a 4.21 to 4.68x amplification, cannot be independently checked from the abstract alone. The design itself has a real strength: the evidence anchors are deterministic, derived directly from OHLCV chart data rather than assigned by a human rater, and the evaluation covers 20 separate VLMs across 969 queries.
Risks and caveats
No model names are attached to any of the findings, so it is not possible to tell which VLM had the lowest UCR score or which strict base-to-fine-tuned pairs showed the largest BUY:SELL shift. The paper also does not say what the oracle in oracle-aided verification is checked against, or how the 969 queries split across the three input modalities. NDR, the benchmark's coverage-aware reliability score, is explicitly not a measure of realized trading performance: a high score says the evidence-to-action chain holds together, not that following a model's BUY or SELL calls would have made money.
“These results show that financial VLM evaluation should trace the full evidence-to-action chain rather than rely on a single hallucination score.”
— Xiaoya Wang and co-authors, E2A-Bench paper