Google's PhotoScan estimates insulin resistance from a phone photo
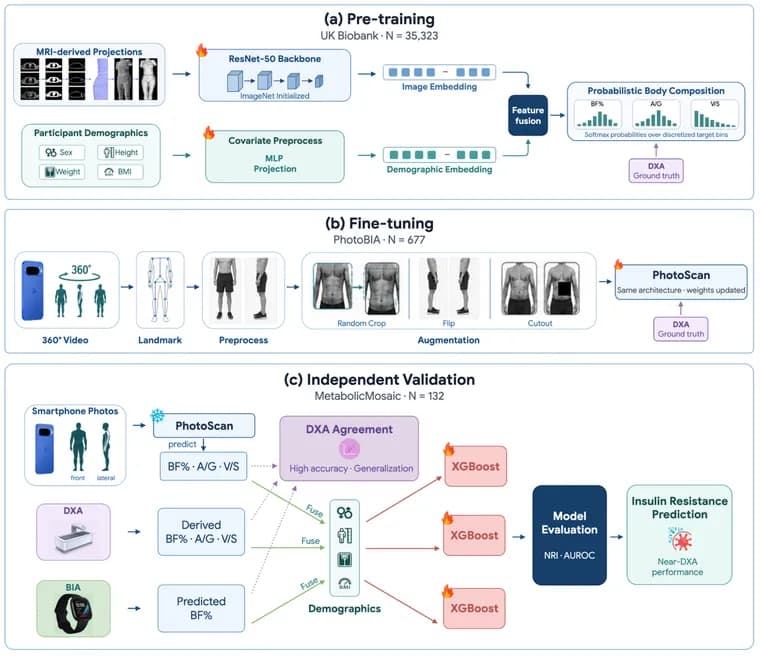
Google Research published a study describing PhotoScan, a deep learning system that estimates three body composition measurements (body fat percentage, the android to gynoid fat ratio known as A/G, and the visceral to subcutaneous fat ratio known as V/S) directly from ordinary 2D photos taken on a smartphone. The goal is a cheap, non-invasive stand-in for insulin resistance screening, which today mostly relies on lab bloodwork or DXA scans that are accurate but too expensive, radiation-exposing and infrastructure-heavy for everyday use. Insulin resistance, measured by the HOMA-IR score, where a score above 2.9 counts as insulin resistant, can silently precede a type 2 diabetes diagnosis by years.
To build PhotoScan, the researchers pretrained a deep neural network on over 35,000 participant records from the UK Biobank, then fine-tuned it on a new cohort of 677 adults. They tested the fine-tuned model on two cohorts: PhotoBIA, evaluated with 5 fold cross-validation, and MetabolicMosaic, used as an independent validation set. On PhotoBIA, PhotoScan's body fat percentage predictions had a mean absolute error (MAE) of 2.15, more accurate than a smartwatch bioelectrical impedance analysis (BIA) sensor's MAE of 2.91 on the same task; PhotoScan's A/G and V/S ratio MAEs were 0.107 and 0.094. On MetabolicMosaic, the equivalent MAEs were 2.13 for body fat percentage, 0.085 for A/G and 0.085 for V/S. Google Research attributes the modest drop in A/G and V/S error to MetabolicMosaic containing a higher share of female records (67%) than PhotoBIA (57%), since women tend to have lower absolute A/G and V/S ratios.
The researchers then tested whether PhotoScan features actually improve prediction of insulin resistance itself, using a gradient boosting classifier on the MetabolicMosaic cohort with test groups balanced by BMI and insulin resistance status. A baseline model using only demographics (age, sex, BMI) reached an AUROC of 0.692. Adding PhotoScan's body composition estimates raised that to an AUROC of 0.760 and a Net Reclassification Index (NRI) of 0.593, close to the ceiling set by adding gold standard DXA scans instead, which reached an AUROC of 0.773 and an NRI of 0.748. By contrast, adding smartwatch BIA data to the same baseline produced no improvement in AUROC or NRI, since BIA only supplies body fat percentage while the A/G and V/S ratios, which among the smartphone-based methods only PhotoScan provides, carried more of the predictive weight.
Google Research frames PhotoScan as a research prototype, not a shipped product, and says the results show smartphone-based body composition estimation is feasible as a scalable tool for cardiometabolic research. The authors, research scientist Cassie Zhou and staff research scientist Ahmed Metwally, say future work will look at combining PhotoScan with continuous wearable data, glucose dynamics and clinical blood biomarkers.
Key facts
- PhotoScan estimates body fat percentage, A/G ratio and V/S ratio from standard 2D smartphone photos, pretrained on over 35,000 UK Biobank records and fine-tuned on a cohort of 677 adults.
- In the PhotoBIA cohort, PhotoScan's body fat percentage prediction had a mean absolute error of 2.15, beating a smartwatch BIA sensor's 2.91.
- Adding PhotoScan features to a baseline demographic model raised insulin resistance classification AUROC from 0.692 to 0.760 (NRI 0.593), close to the top DXA-based model's AUROC of 0.773 (NRI 0.748).
- Adding smartwatch BIA data to the same demographic baseline produced no improvement in AUROC or NRI for insulin resistance classification.
- PhotoScan remains a research prototype; Google Research says it plans to combine it with wearable data, glucose dynamics and blood biomarkers.
Why it matters
Insulin resistance is one of the most common and most underdiagnosed drivers of metabolic disease, often preceding a type 2 diabetes diagnosis by years while standard blood sugar tests still look normal. The clinical gold standard for measuring the body composition that predicts it, a DXA scan, is accurate but expensive, requires specialized equipment and exposes patients to radiation, so it is not used for routine screening. PhotoScan shows that a deep learning model reading ordinary smartphone photos can estimate the same body composition metrics closely enough to meaningfully improve insulin resistance prediction, without DXA's cost or infrastructure requirements.
Who it affects
The immediate audience is cardiometabolic researchers and clinicians looking for scalable, non-invasive screening tools; Google Research positions PhotoScan as a research instrument rather than a consumer app. Longer term, the people who stand to benefit are anyone at risk of undiagnosed insulin resistance or type 2 diabetes, since a phone-camera-based screen could reach far more people than DXA access allows. It has no immediate effect on anyone outside these research and clinical settings, since Google Research has not announced a product or a timeline for one.
How to use it
PhotoScan is not available as a product, app or API. It exists as a research model described in a Google Research blog post, built by pretraining a neural network on over 35,000 UK Biobank participant records and fine-tuning it on a new cohort of 677 adults. No pricing, release date or access mechanism is given; the post frames it strictly as evidence that smartphone-based body composition estimation is technically feasible for future research use.
How solid is it
The claims rest on two real clinical cohorts rather than simulation. PhotoScan's body fat percentage estimates were validated with 5 fold cross-validation on the PhotoBIA cohort (MAE 2.15, versus 2.91 for a smartwatch BIA sensor) and confirmed on a separate, independent MetabolicMosaic cohort (MAE 2.13), which is a meaningful check against overfitting. The downstream insulin resistance classification test used a gradient boosting classifier with test groups balanced by BMI and insulin resistance status specifically to avoid a biased comparison, and PhotoScan-based features (AUROC 0.760, NRI 0.593) landed close to the DXA-based ceiling (AUROC 0.773, NRI 0.748) rather than merely beating the weak demographic-only baseline (AUROC 0.692). Google Research has not stated whether this research has been peer reviewed or published in a journal.
Risks and caveats
PhotoScan is explicitly a research prototype, not a validated clinical or consumer tool, and Google Research gives no timeline for it becoming one. Peer review or publication status is not stated. The two evaluation cohorts differ in sex composition, 57% female in PhotoBIA versus 67% in MetabolicMosaic, which Google Research says accounts for the modest accuracy gap between them; no other demographic details, such as age range, geography or ethnicity, are given for either cohort, so how the model performs across broader populations is untested here. The 677 person fine-tuning cohort is also small relative to the 35,000 record pretraining set, and the source does not break down how those 677 adults split between the two evaluation cohorts.