OlmoEarth v1.3 releases open 10 m satellite embeddings for the whole planet
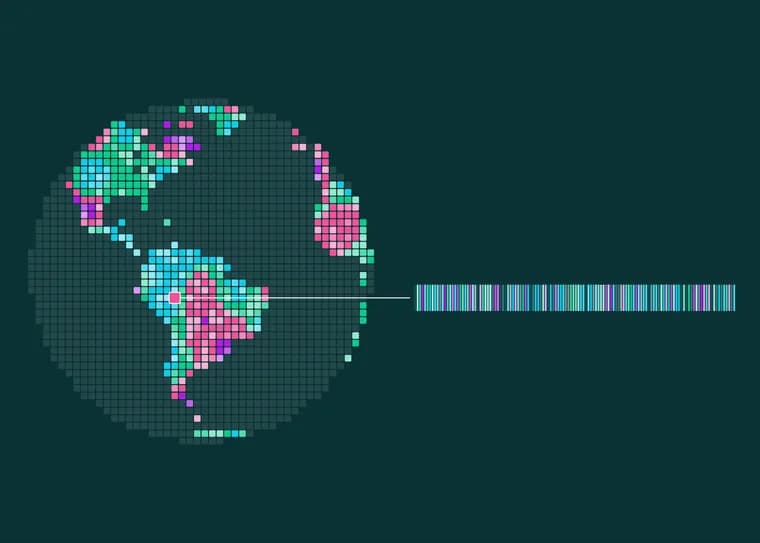
The OlmoEarth team has released OlmoEarth v1.3, a satellite embedding model, together with precomputed annual embeddings for the whole planet at 10-meter resolution (in 64- and 128-dimensional versions) and a new browser-based tool, the OlmoEarth Embeddings Explorer. The pitch is that anyone can put the model to work right away, from tracking change over time to finding similar places, with no sign-in and no advanced technical knowledge.
Until now, the main way to use OlmoEarth was fine-tuning in OlmoEarth Studio: training a model for each task and running it over satellite imagery to make a map. That requires GPU access and the ability to download and store the imagery. Embedding models instead compress satellite data into ready-to-use features that can be reused cheaply for many tasks.
How it works: v1.3 reads a year of radar (Sentinel-1) and multispectral (Sentinel-2 and Landsat) time series. A vision transformer reads the data, an Attention Pooler pools it into one vector per patch of land, and a linear layer reduces it to 128 numbers. The result is one 128-dimensional vector for every 10-meter pixel on Earth; the first 64 dimensions also work on their own as a smaller embedding. The team computed these for the entire planet and shared them on Source Cooperative, so a crop map, land-cover map or change analysis becomes a lightweight problem: train a small classifier on top and run it locally.
The authors evaluated v1.3's embeddings against AlphaEarth Foundations (AEF) and Tessera v2 across 27 evaluations covering six continents and many tasks. The 128-dimensional embeddings score highest on 20 of 27 and rank highest overall. The 64-dimensional version, at half the size, still leads on 18 of 27. As part of this work they introduce PLANTEUR, a new crop-type benchmark for tropical farming, and say the embeddings generalize best to places a classifier has never seen. Example uses named in the post: classifying smallholder crops in Kenya, detecting brick kilns west of Dhaka, assessing fire damage in Indonesia, and tracking gold mining in the Peruvian Amazon.
On cost, the authors call v1.3 their cheapest model to train: 53% of the computing time of v1.2 and 18% of v1, with 50% and 22% of the carbon emissions respectively. They say it also remains a strong fine-tuning model, matching v1.2's performance across research and partner labels. If you wanted to reproduce it, pre-training OlmoEarth v1.3 Base would cost roughly $2,720 of rented H100 time for the final run. Weights, pretraining data and pretraining code are all open.
The worked example is Peru's Madre de Dios region. Illegal gold mining around La Pampa peaked in 2017 and 2018, clearing more than 1,200 hectares of forest in the buffer zone of the Tambopata National Reserve, according to Amazon Conservation's MAAP monitoring program. Peru's Operation Mercurio shut most of it down in February 2019. Comparing each pixel's vector across years, with no model training, the 2017 to 2020 pair lights up where mining spread to the southeast. The 2020 to 2025 comparison shows that corner gone quiet, so the crackdown is visible. But the map is not dark: according to MAAP, pockets in the northwest kept operating, and the old mining zone keeps changing as land regrows or is dug again. In August 2026, the Associated Press reported, Peru sent navy patrols back into the reserve after prosecutors found mining had crossed into Tambopata itself.
The Explorer renders the embeddings as a false-color map of the planet. Users can pan anywhere, flip between years, pull up the underlying Sentinel-2 imagery to check the map against reality, click a place to find similar ones, or drop a few labeled points, train a small classifier on the spot and export the result as a GeoTIFF. No account or setup is needed. Where testing an idea against OlmoEarth has meant a fine-tuning run on the order of hours, a first pass in the Explorer takes seconds, with no GPU.
The archive holds embeddings at 10-meter resolution, roughly 150 TB per year, covering land and adjacent coastal waters. At launch, 2025, 2024 and 2023 are global, and 2017 to 2022 cover select countries, with more coverage on the way. Each embedding comes with provenance: for every 20-kilometer tile and year, open tables list the Sentinel-1, Sentinel-2 and Landsat scenes the model read, with links to the public catalogs hosting them. The release covers the OlmoEarth v1.3 Base model, the global embeddings, the Explorer and the technical report. OlmoEarth Studio can run the same model over chosen dates, modalities and resolution, and a tutorial shows how to generate embeddings on your own compute. Everything is under the OlmoEarth Artifact License, the same license as v1 and v1.2.
Key facts
- OlmoEarth v1.3 produces a 128-dimensional vector for every 10-meter pixel on Earth from a year of Sentinel-1, Sentinel-2 and Landsat data; the first 64 dimensions work as a smaller embedding.
- In the authors' evaluation against AlphaEarth Foundations and Tessera v2 across 27 evaluations on six continents, the 128-dimensional version scores highest on 20 and the 64-dimensional version leads on 18.
- Training v1.3 took 53% of the computing time of v1.2 and 18% of v1, with 50% and 22% of the carbon emissions; a final Base pre-training run would cost roughly $2,720 of rented H100 time.
- The browser-based OlmoEarth Embeddings Explorer needs no account or GPU, lets users find similar places or train a small classifier and export a GeoTIFF; a first pass takes seconds.
- Weights, pretraining data and code are open under the OlmoEarth Artifact License; embeddings are global for 2023 to 2025 and cover select countries for 2017 to 2022, at roughly 150 TB per year.
Why it matters
Until now, using OlmoEarth meant fine-tuning a model per task, which needs GPUs and local copies of satellite imagery. Precomputed global embeddings turn many mapping jobs into small classifier problems that run locally, and the Explorer cuts a first test from hours to seconds. The authors also report the cheapest OlmoEarth training run so far, at 53% of v1.2's computing time. The Madre de Dios example shows the practical use: comparing years of embeddings reveals where illegal mining spread, quieted and returned, without training a model.
Who it affects
Teams that map land from satellites: crop and land-cover mapping, change analysis, and monitoring of illegal activity such as mining. The post names smallholder crops in Kenya, brick kilns west of Dhaka, fire damage in Indonesia and gold mining in the Peruvian Amazon. It also affects researchers who compare embedding models, since the release brings the PLANTEUR crop-type benchmark for tropical farming, and teams without GPU access who can now start with the Explorer.
How to use it
Open the OlmoEarth Embeddings Explorer in a browser: pan, switch years, view the underlying Sentinel-2 imagery, click a place to find similar ones, or drop labeled points to train a small classifier and export a GeoTIFF. To work offline, pull the 64- or 128-dimensional embeddings from Source Cooperative and train a small classifier locally. For a specific time window, OlmoEarth Studio runs the same model over the dates, modalities and resolution you choose, and a tutorial covers generating embeddings on your own compute. Fine-tune in Studio when a task calls for it. Everything is under the OlmoEarth Artifact License, the same as v1 and v1.2.
How solid is it
The headline comparison (20 of 27 evaluations for the 128-dimensional version, 18 of 27 for the 64-dimensional one, against AlphaEarth Foundations and Tessera v2) is the authors' own evaluation; the post gives win counts rather than per-task scores, and full results are in the technical report. The weights, pretraining data and code are described as fully open, and each embedding comes with provenance tables listing the source scenes per 20-kilometer tile and year. The Madre de Dios story relies on MAAP (Amazon Conservation) and an Associated Press report for its outside facts. The $2,720 figure is a what-it-would-cost estimate for reproducing the final Base run, not stated as the actual spend.
Risks and caveats
Coverage is uneven at launch: 2023 to 2025 are global, while 2017 to 2022 cover only select countries. The archive is roughly 150 TB per year, so full local use is heavy. The 'best' claim rests on the authors' chosen set of 27 evaluations, which include a benchmark they introduced themselves (PLANTEUR). The authors note the embeddings can help decide whether a task deserves fine-tuning compute and show where the model falls short, so some tasks will still need fine-tuning in Studio. In the Peru example, the maps show where the land changed; the post leans on MAAP and the AP for what the changes mean on the ground.
“In the explorer, a first pass takes seconds.”
— OlmoEarth v1.3 release post