DataVista benchmark tests 19 multimodal LLMs on data videos; best scores 70.0%
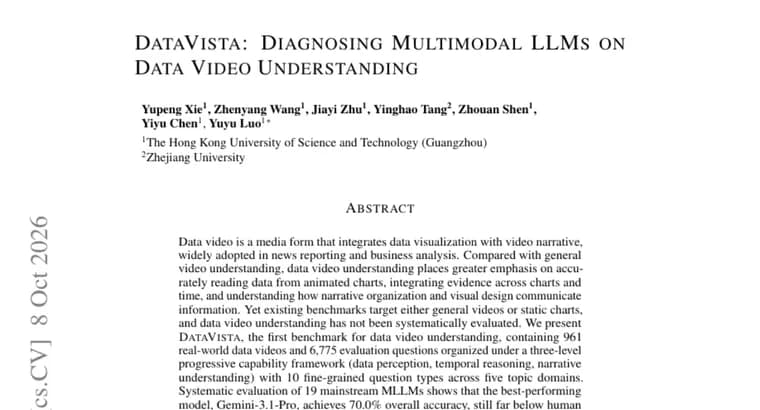
Data videos combine data visualization with video narrative and are widely used in news reporting and business analysis. Understanding them asks more of a model than general video does: it has to read values accurately from animated charts, connect evidence across charts and across time, and grasp how narrative organization and visual design carry information. The paper's authors argue that existing benchmarks target either general videos or static charts, so data video understanding has not been systematically evaluated.
To fill that gap they present DataVista, which they call the first benchmark for data video understanding. It contains 961 real-world data videos and 6,775 evaluation questions. The questions sit under a three-level progressive capability framework (data perception, temporal reasoning, narrative understanding) and span 10 fine-grained question types across five topic domains.
The authors evaluated 19 mainstream multimodal LLMs. The best performer, Gemini-3.1-Pro, achieves 70.0% overall accuracy, which they describe as still far below human expert performance. Models do worst on Causal Reasoning and Narrative Structure questions.
Two further findings stand out. Increasing the number of frames and adding subtitles mainly help data perception and temporal reasoning, with limited gains in narrative understanding. And an analysis of model responses identifies typical failure modes in chart reading, evidence judgment, and instruction understanding. The benchmark is publicly available on GitHub at https://github.com/HKUSTDial/DataVista.
Key facts
- DataVista is presented as the first benchmark for data video understanding: 961 real-world data videos and 6,775 evaluation questions.
- Questions are organized into three levels (data perception, temporal reasoning, narrative understanding), with 10 fine-grained question types across five topic domains.
- Of 19 mainstream multimodal LLMs tested, the best, Gemini-3.1-Pro, reaches 70.0% overall accuracy, still far below human expert performance.
- Models perform worst on Causal Reasoning and Narrative Structure; more frames and subtitles mainly help data perception and temporal reasoning, with limited gains in narrative understanding.
- The benchmark is available on GitHub at HKUSTDial/DataVista.
Why it matters
Data videos are a common format in news reporting and business analysis, yet according to the paper's authors the existing benchmarks cover either general videos or static charts. DataVista is presented as the first to evaluate data video understanding systematically. The result is a concrete gap: even the best of 19 tested models, Gemini-3.1-Pro, gets 70.0% overall accuracy, still far below human experts.
Who it affects
Researchers and developers who build or evaluate multimodal LLMs gain a test aimed at a skill that general video and static chart benchmarks do not isolate. Teams that want models to read animated charts and follow the story a data video tells, as in news reporting and business analysis, get a picture of where current models fall short.
How to use it
The benchmark is available on GitHub at https://github.com/HKUSTDial/DataVista, so it can be used to test other multimodal LLMs. Questions are tagged by three capability levels and 10 question types, so results can be broken down by skill. One finding is practical: increasing frame counts and adding subtitles mainly help data perception and temporal reasoning, so those settings are worth varying when testing.
How solid is it
The numbers come from the paper's own evaluation: 961 videos, 6,775 questions, 19 models. The "first benchmark" label is the authors' claim. The source gives accuracy only for the top model, Gemini-3.1-Pro, at 70.0%; the human expert accuracy figure is not given, only that the best model is far below it. Accuracy figures for the other 18 models and for individual question types are not given either.
Risks and caveats
A single overall score of 70.0% can hide large differences between skills: models do worst on Causal Reasoning and Narrative Structure, and extra frames or subtitles bring limited gains in narrative understanding. The authors list typical failure modes in chart reading, evidence judgment, and instruction understanding. The size of the gains from more frames or subtitles is not quantified, and the names of the five topic domains are not given.